Subscribe to my newsletter
With big data comes a big challenge of visualizing it efficiently. And moreover, if we are developing a machine learning model with pyspark, there are only handful of visualization packages available. Recently, I was developing a decision tree model in pyspark and to infer the model, I was looking for a visualization module.
I came across this awesome spark-tree-plotting package.
This post is about implementing this package in pyspark.
We need few installs to begin with, spark-tree-plotting (.jar can be deployed), pydot, and graphviz.
Using vector assembler, convert individual feature columns into a single vector column. Dataframe will look like,
Let’s define decision tree model,
#decision tree without pipeline
from pyspark import SparkContext, SQLContext
from pyspark.ml import Pipeline
from pyspark.ml.classification import DecisionTreeClassifier
from pyspark.ml.feature import StringIndexer, VectorIndexer
from pyspark.ml.evaluation import MulticlassClassificationEvaluator

#define labelindexer
labelIndexer = StringIndexer(inputCol="label", outputCol="indexedLabel").fit(df_input)

#tran test split
(train, test) = df_input.randomSplit([0.7, 0.3])

#train transform through labelindexer
train_transformed = labelIndexer.transform(train)

#test transform through labelindexer
test_transformed = labelIndexer.transform(test)

#define decision tree model
dt = DecisionTreeClassifier(labelCol="indexedLabel", featuresCol="features")

#fit train data
dt_fit = dt.fit(train_transformed)

#predict on test data
test_predictions = dt_fit.transform(test_transformed)
dt_fit is an object,
DecisionTreeClassificationModel (uid=DecisionTreeClassifier_cfa067d7f423) of depth 5 with 47 nodes
We will use this object to generate a png string (an image object) in python. To save the object, we will convert it into bytes object with Image.open(io.BytesIO(png_string))
from spark_tree_plotting import plot_tree
from spark_tree_plotting import export_graphviz
from PIL import Image
import io

#feature names cane be cosmetic arguments, need not be same as the ones in the input table, as long we have traceability at our end.
png_string = plot_tree(dt_fit,
                       featureNames=['feature1','feature2','feature3','feature4'],
                       categoryNames={},
                       classNames=labelIndexer.labels,
                       filled=True,
                       roundedCorners=True,
                       roundLeaves=True)

image = Image.open(io.BytesIO(png_string))
If you’re still facing issue with dot not in python, run these commands in python terminal,
%sh
sudo apt-get install -y graphviz
pip install pydot
And we can save it as a .png file as
path_for_image = "/save/here/"
image_name = path_for_image + "_" + datetime.utcnow().strftime('%Y_%m_%d_%H_%M_%S') + ".png"
image.save(image_name)
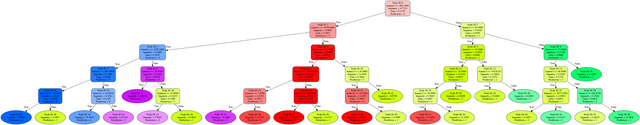
The saved image image looks like,
The image object is high quality (high resolution).
Pretty neat huh, the information shown at each node, is well structured and shows, node number, decision criterion, impurity, gain, and prediction score.
Happy Machine Learning!